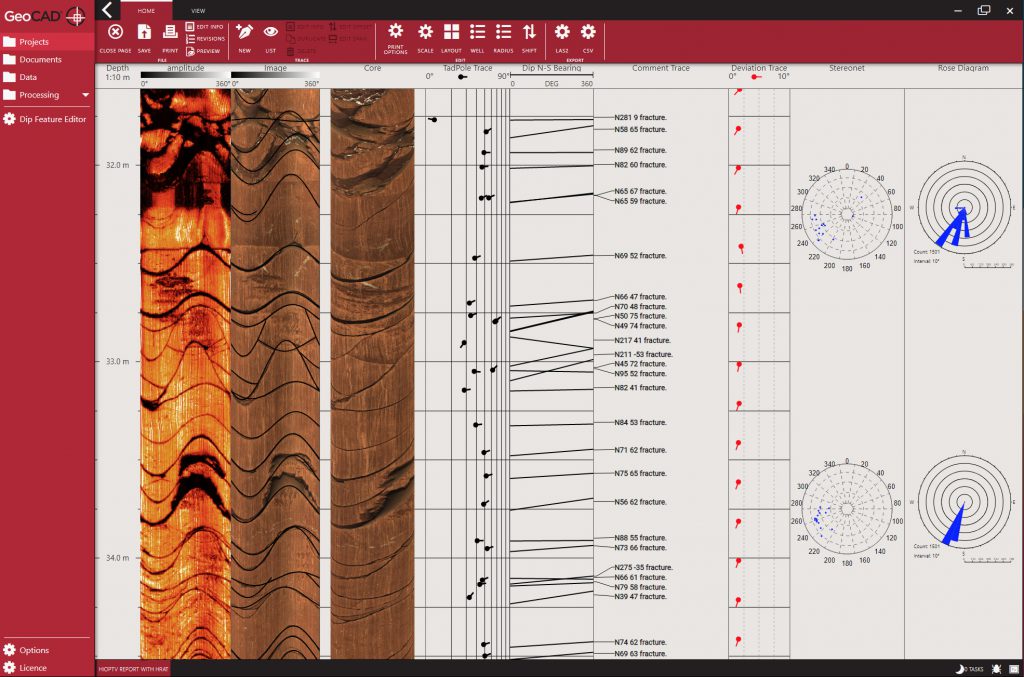
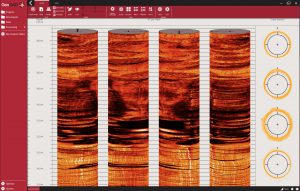
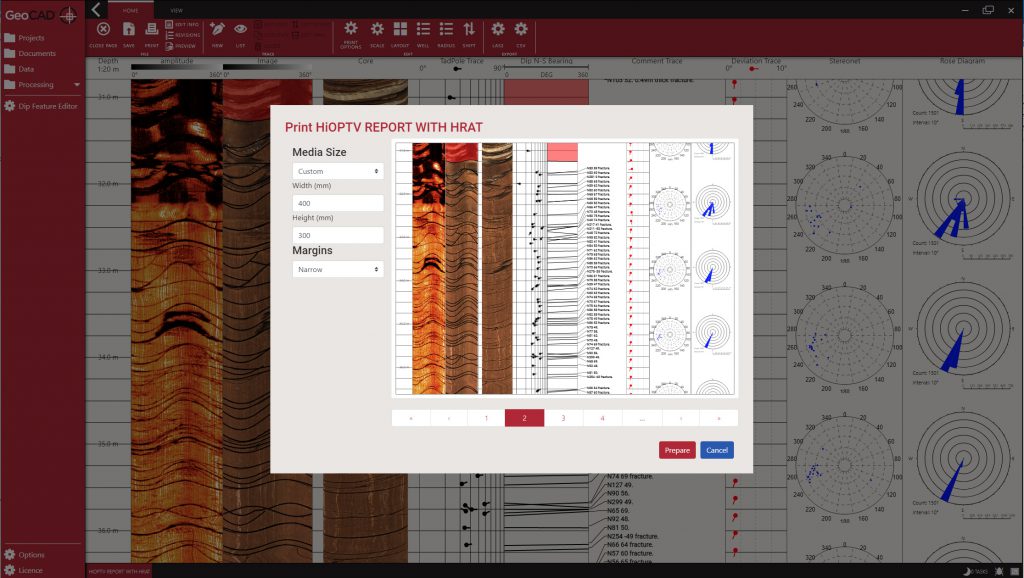
GeoCAD® is a windows-based package for processing, interpreting, and displaying acoustic and optical televiewer image logs. Standard log presentations include tadpole and stick plots, stereographic projections of poles to planes and azimuth frequency diagrams. The synthetic core display allows the convenient comparison of log and field data for the orientation of fractured or incomplete core sections.
Developed by logging professionals with their reporting needs in mind, the software focuses on producing industry-standard televiewer reports quickly and reliably – all you need to create quality reports without any gimmicks and unnecessary and costly extras.
With the emphasis on deliverables, the easy to navigate module and pre-set templates reduce processing time without any compromise on quality.
GeoCAD® is the software of choice for all logging users looking to reduce costs, improve workflows and enhance time management.
Typical HRAT Report
Standard reporting made easy is an important element of GeoCAD® and helps users to produce consistent, high-quality results no matter who processes the data
User Experience:
Easy to navigate
Pre-set industry standard templates
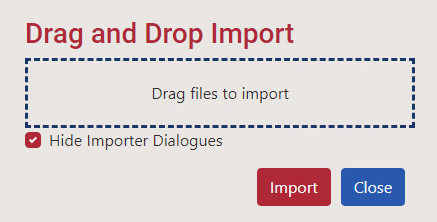
‘Drag & drop’ data import
Quick and easy feature picking tools
Simple and effective ‘final report’ wizard
Standardised reporting
Flexible printing option
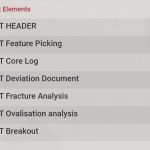
Standard Outputs:
Detailed Reports
Feature Picking Log
Core Log
Deviation Log
Fracture Analysis
Ovalisation Analysis
Breakout Log
3D Core Log
Image Log
Tabulated Data
GeoCAD® Features:
Quick selection menu’s
Drag & drop layout configurator
Powerful feature picking tools
Dip style editor
Real-time data logs
Easy to use document creator
Data generator/export wizard
Revision log
Televiewer Interpretation and Processing
GeoCAD® provides structure picking tools, feature classification, correction, classic reporting and visualisation of Robertson Geo image logs.
The seamless log acquisition to processing workflow offered by the GeoCAD® platform provides the customer with a unique and unrivalled experience.
The GeoCAD® processing and interpretation toolbox provides:
Unlimited recording of picked bedding and fracture features with azimuth, dip and thickness or aperture reported
Features can be categorised (classed) using a fully customised menu
The picked features can be complete or partial
The recording of linear features such a breakout and tensile fractures
Feature thickness
Features are displayed as a sinusoid, partial sinusoid, tadpole and stick plots
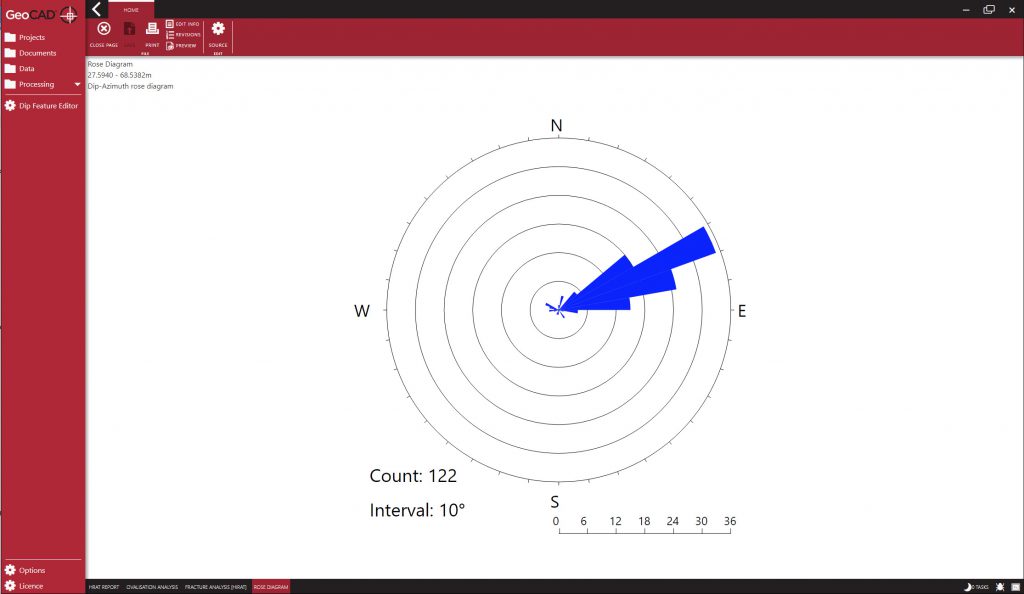
Dips can be presented as stereonet, histogram or rose diagram
The original core images can also be imported and presented with the process logs
GeoCAD® for Televiewers fast and easy to use ‘feature picking’ interface saves time and is an ideal platform for professional and first-time users alike.
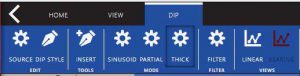
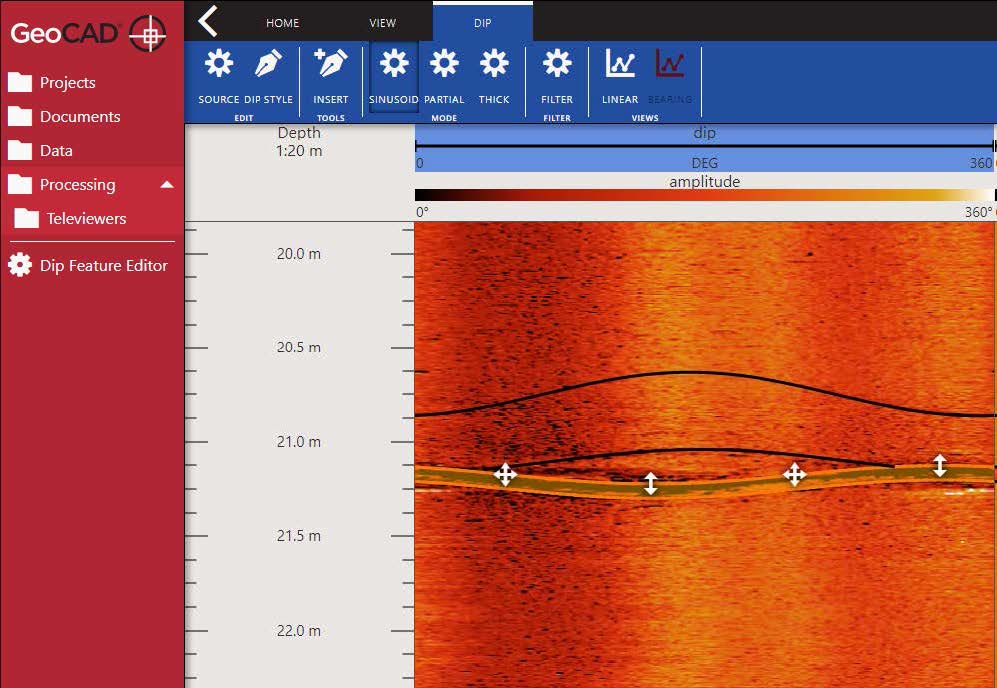
Users can create individual ‘classifications’ using the feature editor and set defaults for commonly selected features. The dip menu allows the selection of feature type by sinusoid, partial and thick. The ‘thick’ function will measure the thickness of the bedding or fracture picked as shown in the example here.
Other typical outputs as part of the fracture analysis module include the generation of stereonet, histogram and rose
diagrams.
Ovalisation and breakout plots can also be produced.
‘Drag & drop’ function speeds up the file importation and processing procedure.
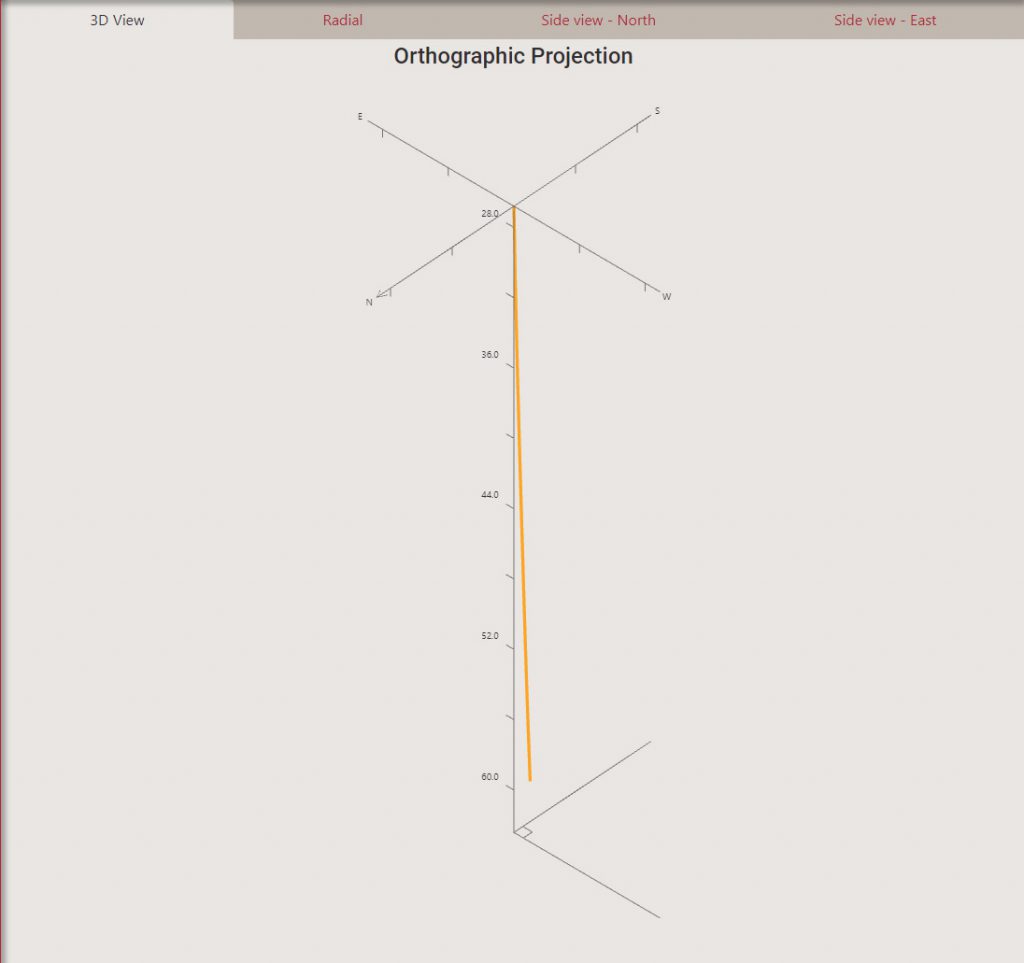
Standard deviation plots and data sets are available as part of the reports.
Flexible print wizard makes reporting quick and easy.